
A visual monitoring system: what already works, what is still in progress, and how I want to catch problems on sites before visitors do.
A WordPress or plugin update can close a security hole and, at the same time, quietly break how a site looks. I maintain many client sites, and it matters to me to find out about such problems before visitors notice them. Checking the important pages by hand on desktop and mobile after every update is difficult, so I built my own system for it. It compares pages before and after changes, a technique known as visual regression testing, and helps me find differences faster.
These are interim results of an alpha version. The main features already work, but the system still needs my supervision, and I am testing it on real sites.
Why I am doing this
Updates used to follow a simple strategy: don't rush. An update came out, you waited a week or two, read what other users reported, and only then updated your own site. For a long time this was considered a sensible approach.
In my observation, critical updates for the core and plugins have become noticeably more frequent, and the risk of postponing them has grown with them. If a fix closes a vulnerability that is already being used in attacks, it is important to install it without unnecessary delay. But after the update you need to make sure the site still looks and works as before.
My goal is to shorten the time between an important update being released and installed, and then to check the result faster.
Why not a ready-made service
Visual comparison of pages is not a new idea: there are paid services and ready-made tools for developers. I decided to build my own system for several reasons.
- Limited resources of organizations. Many of the sites I maintain belong to charities and foundations. As a rule, they have no spare resources to pay for separate monitoring services for each site, and I do not want to increase their maintenance costs.
- My own workflow. Ready-made services offer their own process: their own schedules, their own settings, their own way of accepting changes. I want the checks to fit into my update routine, not the other way around.
- The specifics of the sites I maintain. Most of them run on WordPress and page builders such as Divi, with host-level caching, lazy loading of images, and sliders. Because of this, generic tools often produce many false alarms. My own system lets me tune its behavior to these specifics.
- Control over data. Page snapshots and the history of checks are stored on my server, not with a third-party service.
I do not plan to resell the system. It is an internal tool that helps me maintain sites at the highest level and learn about problems in advance.
How visual regression testing works here
The system regularly takes snapshots of a site's pages and compares them with a baseline, that is, a snapshot I have accepted as correct. If a page looks different, the system shows how much it differs and exactly where.
For regular checks I do not select all pages, only the important ones. When I add a site, the system finds its pages from the sitemap and shows a list. From it I mark the home page, key sections, pages with forms, and samples of the main templates. For posts, a few examples are enough to confirm that the template has not broken. The system does not check the other pages, so a problem that exists only on an unchecked page can go unnoticed.
An important clarification: for now the system checks only the appearance of the selected pages. It opens them as an ordinary visitor, without logging in and without entering any data. It can notice a missing button, a shifted header, or an empty block in place of a gallery, but it does not check whether a form submits a request or whether checkout completes.
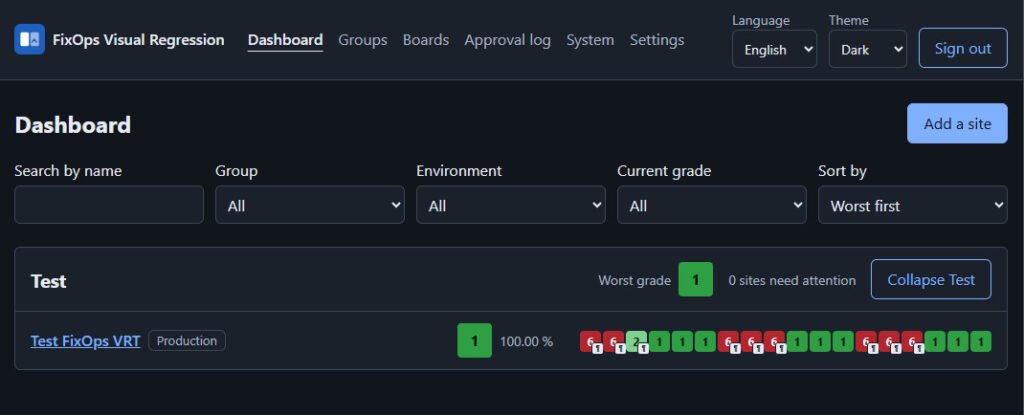
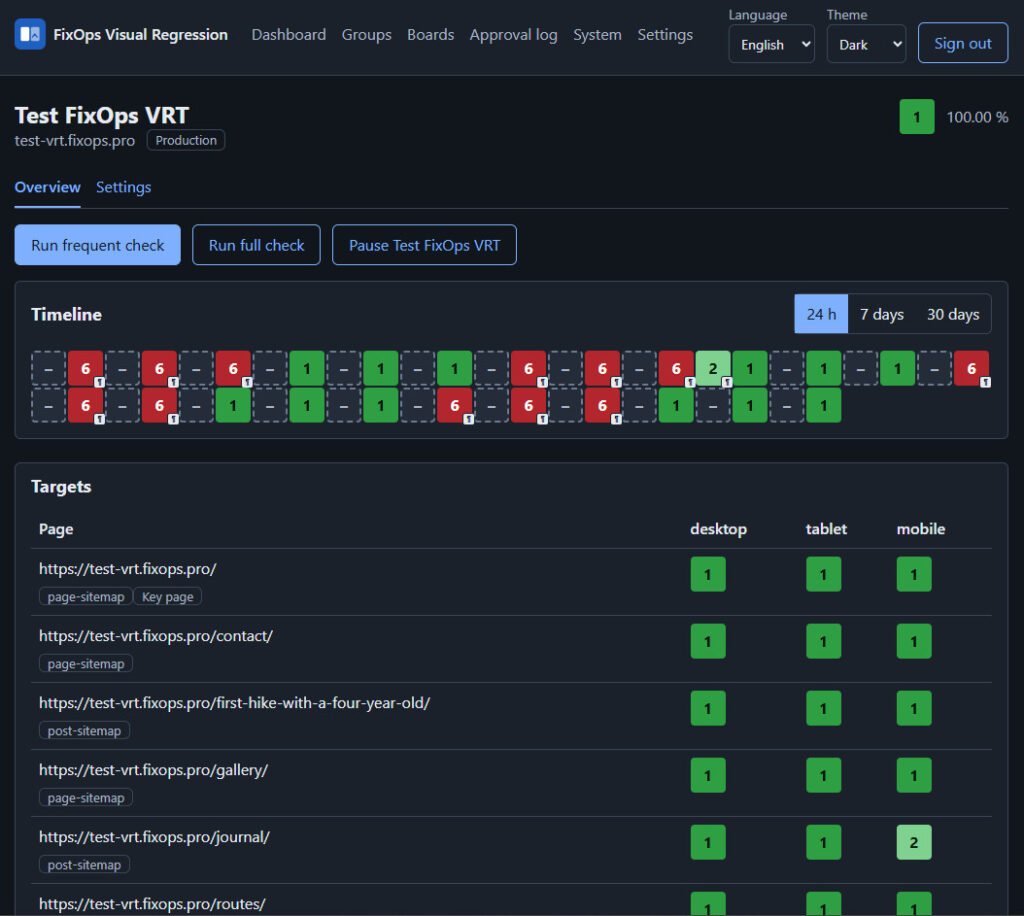
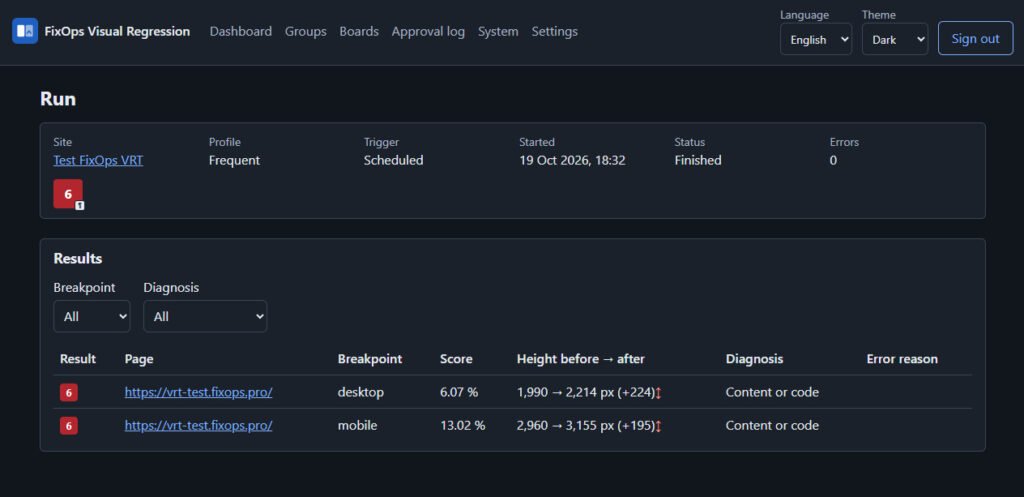
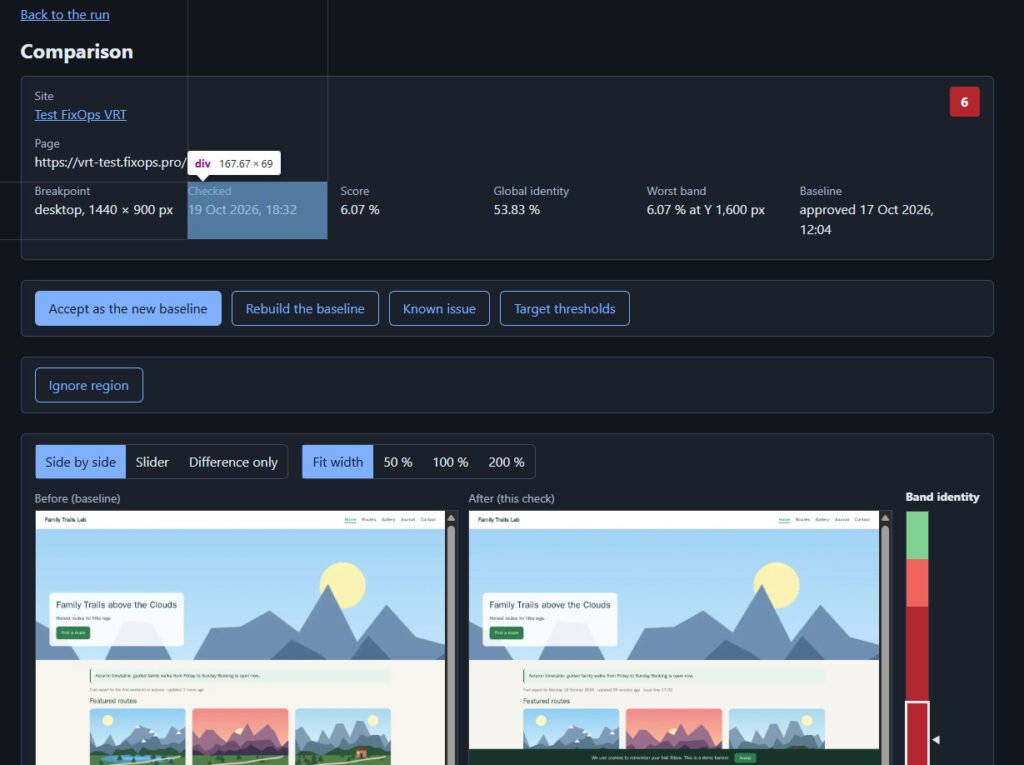
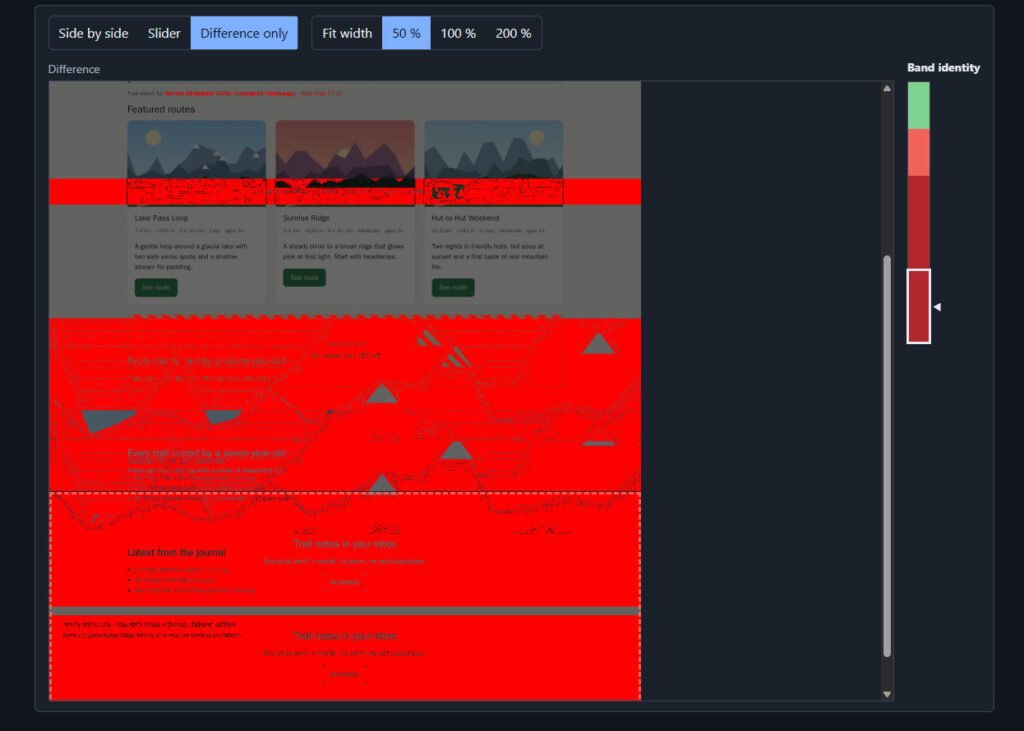
Each check gets a score on a scale from 1 to 6: the higher the score, the bigger the difference from the baseline. Red means the page needs to be reviewed. The change may also be intentional. Special states, such as "page unavailable" or "known issue", are shown separately.
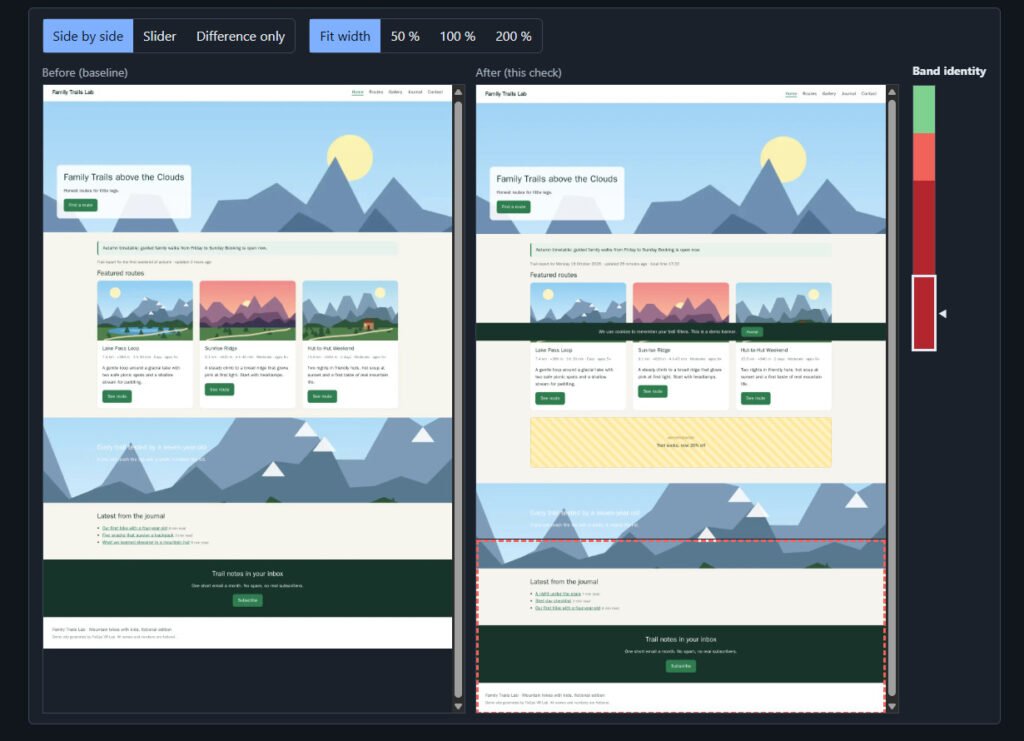
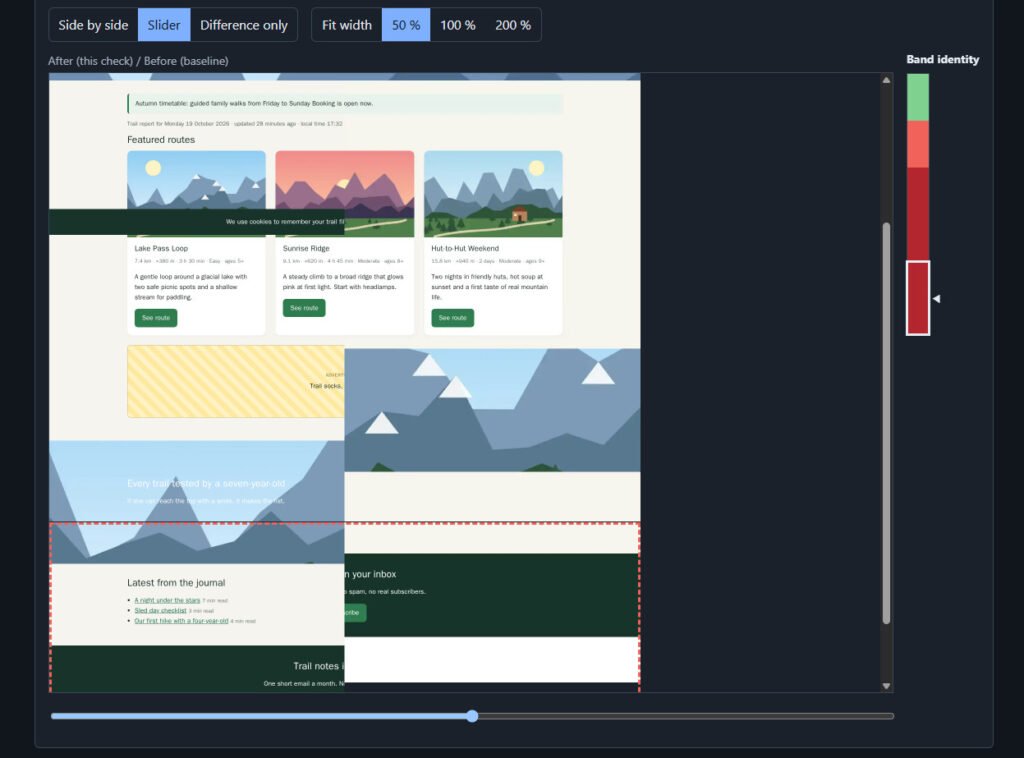
The control panel shows a list of sites, a colored row of checks for each of them, and a viewer where you can compare the "before" and "after" states side by side, with a slider, or by the difference only.
The workflow looks like this:
- An important update is released.
- I install it on the sites.
- The system checks the selected pages and marks those where the appearance has changed.
- I first review the sites where the system found changes. This helps me quickly see where my attention is needed.
- If the change is acceptable, I accept the new look as the baseline with one button.
How often and at what sizes pages are checked
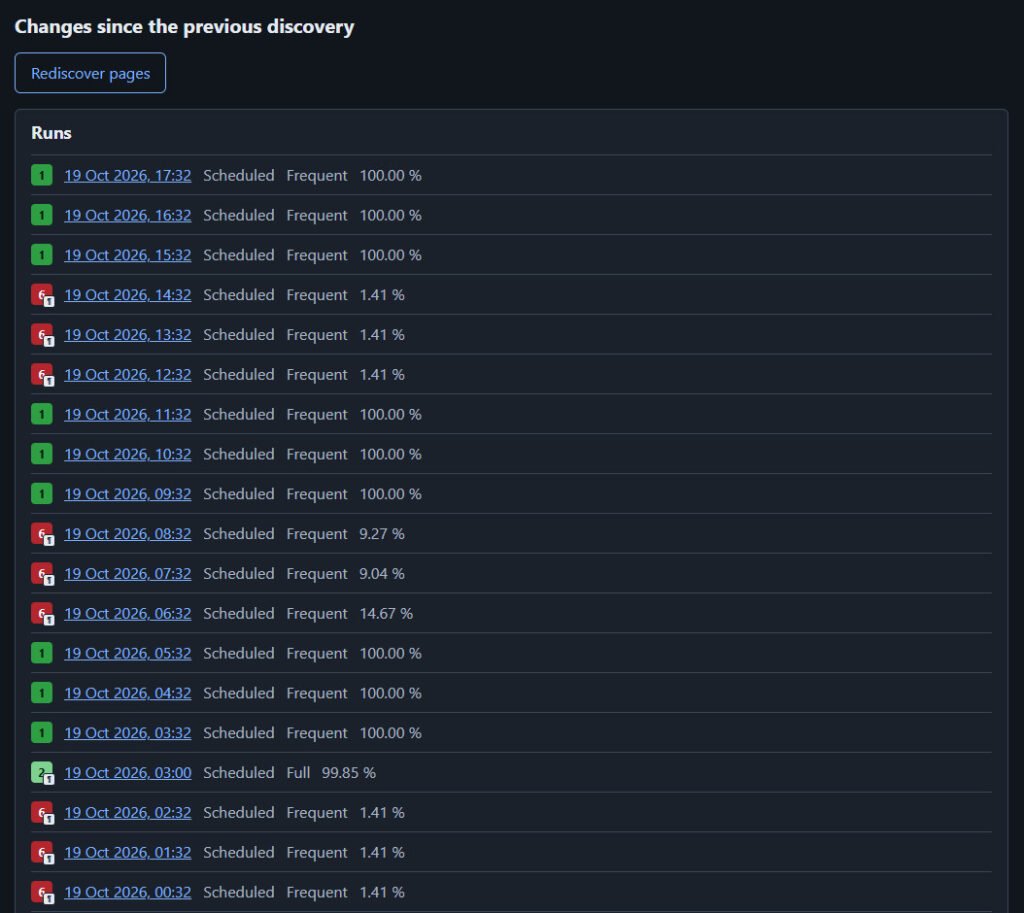
Each selected page is captured at desktop, tablet, and phone screen sizes. This matters because a site can look fine on a computer and break on a phone.
There are two schedules:
- Frequent check runs every hour and covers only the key pages among the selected ones, at desktop and phone sizes.
- Full check runs once a day and covers all selected pages at all three sizes.
Any check can also be started manually, for example right after an update.
How it works
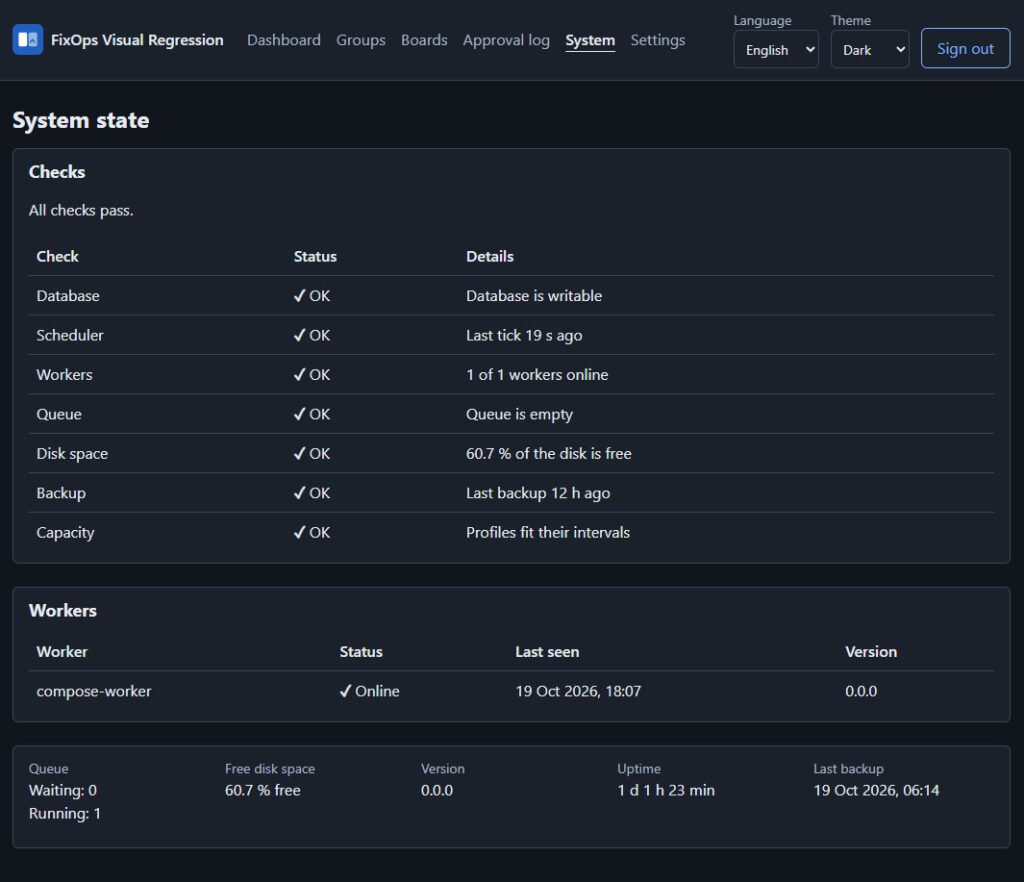
The system opens the selected pages in a browser, takes snapshots, and compares them with the approved baseline. The results are collected in one panel. A separate status page for sites could later be shown to a client; that part is still in development. Everything runs on a single server.
How I test
The first trials on several local sites showed that repeated snapshots of the same page usually come out very similar. On real sites there turned out to be more changing elements, so the main work right now is reducing the number of false alarms.
For testing on real sites I connected working projects, including a large group of sites belonging to one client. In addition, I created a special test plugin for WordPress. On command, it breaks a demo site in known ways: it turns on a slider, inserts random text, shifts a button, changes a font, imitates a stale cache. Because I know exactly what was changed, I can count how many changes the system missed and how many times it raised a false alarm.
What does not work as it should yet
- False alarms on "live" pages. Sliders, video backgrounds, animations, captchas, and blocks with random text look different on every capture, and the system takes this for a breakage.
- Incomplete baselines. If images load as you scroll, a baseline is sometimes captured without them.
- Stale hosting cache. A visitor may be shown an old version of a page, and the system captures exactly that.
- Not enough explanations. When a capture fails, the interface does not always say why.
- Inconvenient handling of large sites. Choosing pages from a list of several thousand entries is still hard.
What I am improving next
- Reducing the number of false alarms on dynamic pages.
- Adding clear reasons for failed checks.
- Making it simpler to choose important pages and to review results.
Planned
- An AI assistant. It will be able to read statistics, run checks, re-check doubtful cases, and suggest exclusions, for example for a slider. The decision to accept a new baseline will always remain with a person.
- Checking that the site works. Besides appearance, the system will check how forms, login, and the cart work.
What this will give
For now the system is suitable for trial use and for finding weak spots, but not for blind trust. The main goal of the coming weeks is to make red almost always mean a real problem, and not a slider, a captcha, or a slow third-party script. Then checking the result after an update will take a few minutes instead of hours of manual work, and I will be able to learn about a problem on a site before visitors do and fix it before it affects the people who use the site.
I will continue testing and will publish the results: how many sites were checked, how many false alarms remain, and which settings turned out to be the most useful.